Saturday, December 6, 2014

Metric system in the US

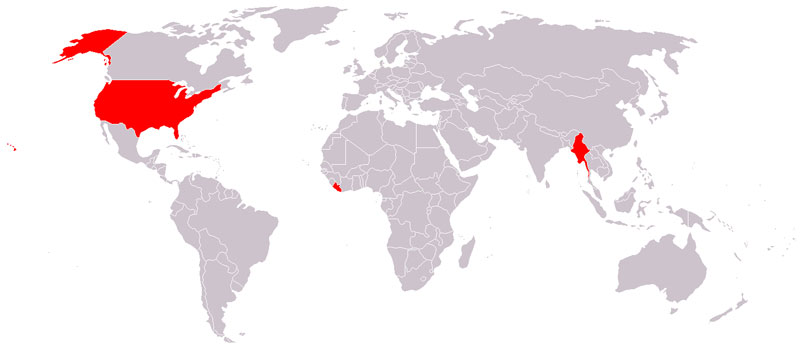
3 countries do not make use of the metric system:


Liberia, Myanmar, and the United States are the only countries that don't use the metric system

As Vox’s Susannah Locke wrote, "The measuring system that the United States uses right now isn’t really a system at all. It’s a hodgepodge of various units that often seem to have no logical relationship to one another — units collected throughout our history here and there, bit by bit. Twelve inches in a foot, three feet in a yard, 1,760 yards in a mile." That’s why the rest of the world uses the metric system, where "all you need to do is multiply or divide by some factor of ten. 10 millimeters in a centimeter, 100 centimeters in a meter, 1,000 meters in a kilometer. Water freezes at 0°C and boils at 100°C."


But, as some people still remember (hello, Michel T!), there was a movement in the 70ies to move to the metric system in the US as well. This is documented in the recent book "Whatever happened to the metric system?" reviewed by the New York Times hereunder

WHATEVER HAPPENED TO THE METRIC SYSTEM?
How America Kept Its Feet
By John Bemelmans Marciano
Illustrated. 310 pp. Bloomsbury. $26.

In the 1970s, children across America were learning the metric system at school, gas stations were charging by the liter, freeway signs in some states gave distances in kilometers, and American metrication seemed all but inevitable. But Dean Krakel, director of the National Cowboy Hall of Fame in Oklahoma, saw things differently: “Metric is definitely Communist,” he solemnly said. “One monetary system, one language, one weight and measurement system, one world — all Communist.” Bob Greene, syndicated columnist and founder of the WAM! (We Ain’t Metric) organization, agreed. It was all an Arab plot “with some Frenchies and Limeys thrown in,” he wrote.
Krakel and Greene might sound to us like forerunners of the Tea Party, but in the 1970s meter-bashing was not limited to right-wing conservatives. Stewart Brand, publisher of the Whole Earth Catalog, advised that the proper response to the meter was to “bitch, boycott and foment,” and New York’s cultural elite danced at the anti-metric “Foot Ball.” Assailed from both right and left, the United States Metric Board gave up the fight and died a quiet death in 1982.
In his entertaining and enormously informative new book, “Whatever Happened to the Metric System?,” John Bemelmans Marciano tells the story of the rise and fall of metric America. With a keen ear for anecdotes and a sharp eye for human motivations, Marciano brings to life the fight over the meter, its champions and its enemies. The 1970s bookend his narrative, but the reader soon finds the struggle lasted not a decade but centuries. And in what was to me the book’s greatest revelation, the meter — that alleged vehicle of international Communism — turns out to be American through and through.
The father of American metrication was none other than Thomas Jefferson, who in the 1780s turned his attention to replacing the menagerie of doubloons, pistoles and Spanish dollars then in use in the states. Jefferson proposed minting a new dollar, but whereas the European coins were divided into halves, eighths, sixteenths, etc., the American coin would be divided into tenths, hundredths and thousandths. When Jefferson’s plan was approved by Congress, the United States became the first country to adopt the decimal system for its currency.
That money is related to measurement might seem counterintuitive today. But as Marciano points out, until very recently the value of coins was ultimately dependent on their weight in gold or silver, which means the divisions of a currency imply a division of weight. And so, when Jefferson arrived in Paris as a diplomat in 1784, he joined forces with French luminaries in promoting a complete reform of weights and measures. Their opportunity came only a few years later, when at the height of the French Revolution its leaders cast away all traditional measures and replaced them with the new meter, kilogram and ­liter. Jefferson, who had returned home in 1789, was convinced the new system would be promptly adopted in America.
It didn’t turn out that way. As France descended into terror and war, the metric system became entangled in a worldwide struggle over its legacy. To its supporters it stood for reason and democracy; to its detractors, godlessness and the guillotine. It was not until the aftermath of World War II, when new global institutions were established and a host of new nations adopted the meter, that its place as the near-­universal measure was secured.
In America, however, repeated efforts at metrication, from Jefferson to Jimmy Carter, were scuttled by a formidable combination of hostility and indifference. According to Marciano the debate is now over, since the digital revolution has made conversion instantaneous and a change of system pointless. Still, as his book beautifully shows, clashes over the meter were more often about ideology, not utility. And so, as long as the struggle continues over reason and faith, universalism and tradition, I wouldn’t count the meter out.

Serendipity in research

Fascinating reading by the New Yorker on how geologists discovered that a meteorite had caused a massive extinction: basically, they used iridium as a simple marker for the time taken for a layer of clay to deposit, and they discovered so much iridium in that clay that they hypothesized that  a large meteorite had collided with earth at that time. Serendipity indeed!


All the way into the nineteen-sixties, paleontologists continued to give talks with titles like “The Incompleteness of the Fossil Record.” And this view might have persisted even longer had it not been for a remarkable, largely inadvertent discovery made in the following decade.
In the mid-nineteen-seventies, Walter Alvarez, a geologist at the Lamont Doherty Earth Observatory, in New York, was studying the earth’s polarity. It had recently been learned that the orientation of the planet’s magnetic field reverses, so that every so often, in effect, south becomes north and then vice versa. Alvarez and some colleagues had found that a certain formation of pinkish limestone in Italy, known as the scaglia rossa, recorded these occasional reversals. The limestone also contained the fossilized remains of millions of tiny sea creatures called foraminifera. In the course of several trips to Italy, Alvarez became interested in a thin layer of clay in the limestone that seemed to have been laid down around the end of the Cretaceous. Below the layer, certain species of foraminifera—or forams, for short—were preserved. In the clay layer there were no forams. Above the layer, the earlier species disappeared and new forams appeared. Having been taught the uniformitarian view, Alvarez wasn’t sure what to make of what he was seeing, because the change, he later recalled, certainly “looked very abrupt.”
Alvarez decided to try to find out how long it had taken for the clay layer to be deposited. In 1977, he took a post at the University of California at Berkeley, where his father, the Nobel Prize-winning physicist Luis Alvarez, was also teaching. The older Alvarez suggested using the element iridium to answer the question.
Iridium is extremely rare on the surface of the earth, but more plentiful in meteorites, which, in the form of microscopic grains of cosmic dust, are constantly raining down on the planet. The Alvarezes reasoned that, if the clay layer had taken a significant amount of time to deposit, it would contain detectable levels of iridium, and if it had been deposited in a short time it wouldn’t. They enlisted two other scientists, Frank Asaro and Helen Michel, to run the tests, and gave them samples of the clay. Nine months later, they got a phone call. There was something seriously wrong. Much too much iridium was showing up in the samples. Walter Alvarez flew to Denmark to take samples of another layer of exposed clay from the end of the Cretaceous. When they were tested, these samples, too, were way out of line.

The Alvarez hypothesis, as it became known, was that everything—the clay layer from the scaglia rossa, the clay from Denmark, the spike in iridium, the shift in the fossils—could be explained by a single event. In 1980, the Alvarezes and their colleagues proposed that a six-mile-wide asteroid had slammed into the earth, killing off not only the forams but the dinosaurs and all the other organisms that went extinct at the end of the Cretaceous. “I can remember working very hard to make that 1980 paper just as solid as it could possibly be,” Walter Alvarez recalled recently. Nevertheless, the idea was greeted with incredulity.
(...)
Today, it’s generally accepted that the asteroid that plowed into the Yucatán led, in very short order, to a mass extinction, but scientists are still uncertain exactly how the process unfolded. One theory holds that the impact raised a cloud of dust that blocked the sun, preventing photosynthesis and causing widespread starvation. According to another theory, the impact kicked up a plume of vaporized rock travelling with so much force that it broke through the atmosphere. The particles in the plume then recondensed, generating, as they fell back to earth, enough thermal energy to, in effect, broil the surface of the planet.
Whatever the mechanism, the Alvarezes’ discovery wreaked havoc with the uniformitarian idea of extinction. The fossil record, it turned out, was marked by discontinuities because the history of life was marked by discontinuities.

How turning frogs into pregnancy tests is now killing them worldwide

Frogs all over the world are disappearing fast. The culprit is a fungi. According to this New Yorker article, here is how this fungi got spread:


Chytrid fungi are older even than amphibians—the first species evolved more than six hundred million years ago—and even more widespread. In a manner of speaking, they can be found—they are microscopic—just about everywhere, from the tops of trees to deep underground. Generally, chytrid fungi feed off dead plants; there are also species that live on algae, species that live on roots, and species that live in the guts of cows, where they help break down cellulose. Until two pathologists, Don Nichols and Allan Pessier, identified a weird microorganism growing on dead frogs from the National Zoo, chytrids had never been known to attack vertebrates. Indeed, the new chytrid was so unusual that an entire genus had to be created to accommodate it. It was named Batrachochytrium dendrobatidis—batrachos is Greek for “frog”—or Bd for short.


Rick Speare is an Australian pathologist who identified Bd right around the same time that the National Zoo team did. From the pattern of decline, Speare suspected that Bd had been spread by an amphibian that had been moved around the globe. One of the few species that met this condition was Xenopus laevis, commonly known as the African clawed frog. In the early nineteen-thirties, a British zoologist named Lancelot Hogben discovered that female Xenopus laevis, when injected with certain types of human hormones, laid eggs. His discovery became the basis for a new kind of pregnancy test and, starting in the late nineteen-thirties, thousands of African clawed frogs were exported out of Cape Town. In the nineteen-forties and fifties, it was not uncommon for obstetricians to keep tanks full of the frogs in their offices.

To test his hypothesis, Speare began collecting samples from live African clawed frogs and also from specimens preserved in museums. He found that specimens dating back to the nineteen-thirties were indeed already carrying the fungus. He also found that live African clawed frogs were widely infected with Bd, but seemed to suffer no ill effects from it. In 2004, he co-authored an influential paper that argued that the transmission route for the fungus began in southern Africa and ran through clinics and hospitals around the world.
“Let’s say people were raising African clawed frogs in aquariums, and they just popped the water out,” Speare told me. “In most cases when they did that, no frogs got infected, but then, on that hundredth time, one local frog might have been infected. Or people might have said, ‘I’m sick of this frog, I’m going to let it go.’ And certainly there are populations of African clawed frogs established in a number of countries around the world, to illustrate that that actually did occur.”

Saturday, November 22, 2014

Maps and charts

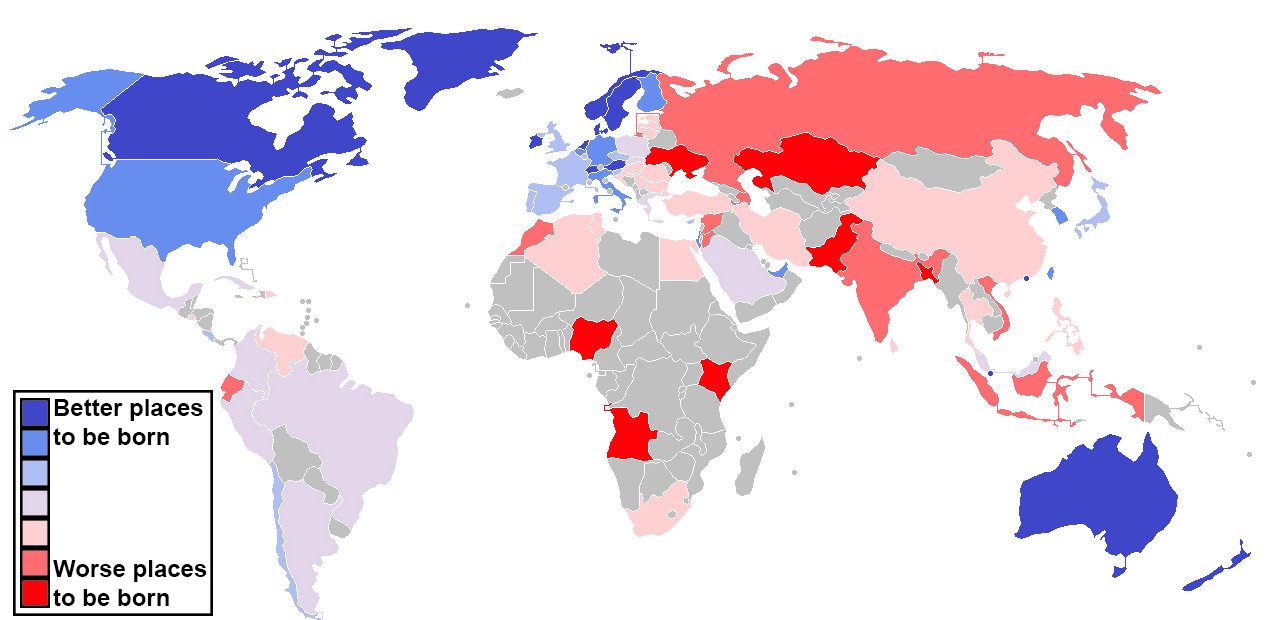
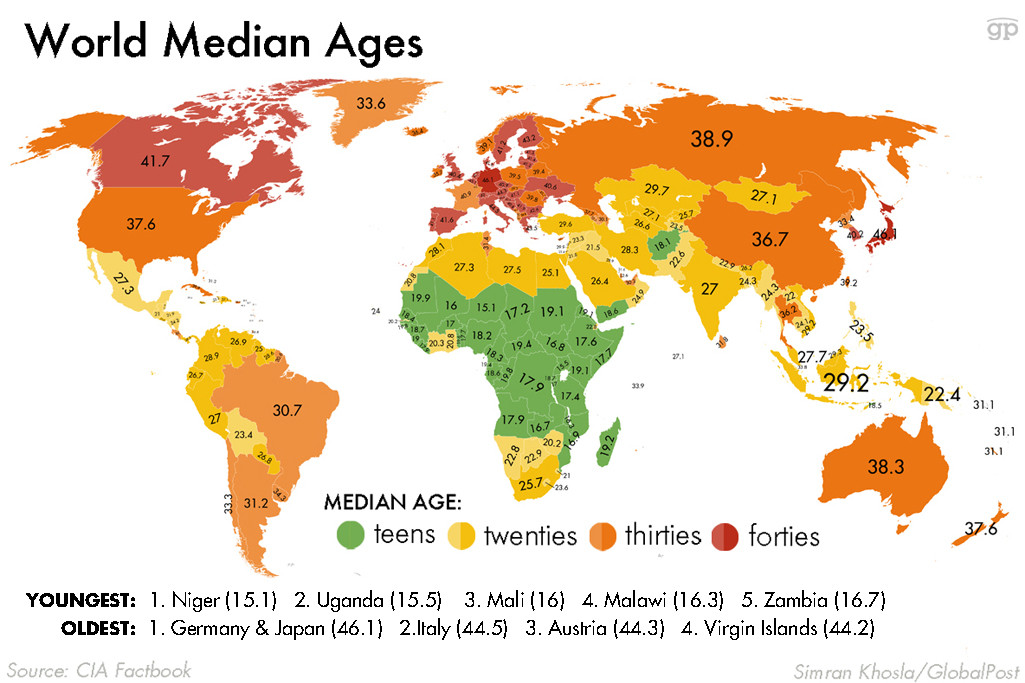
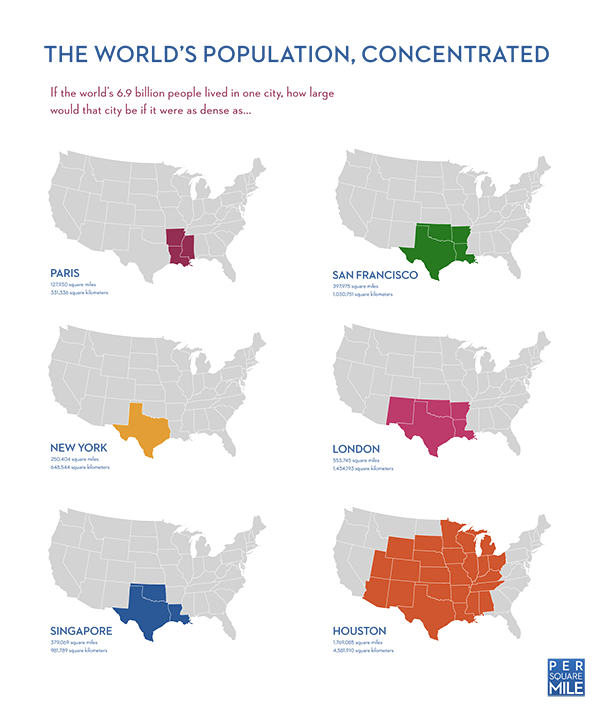
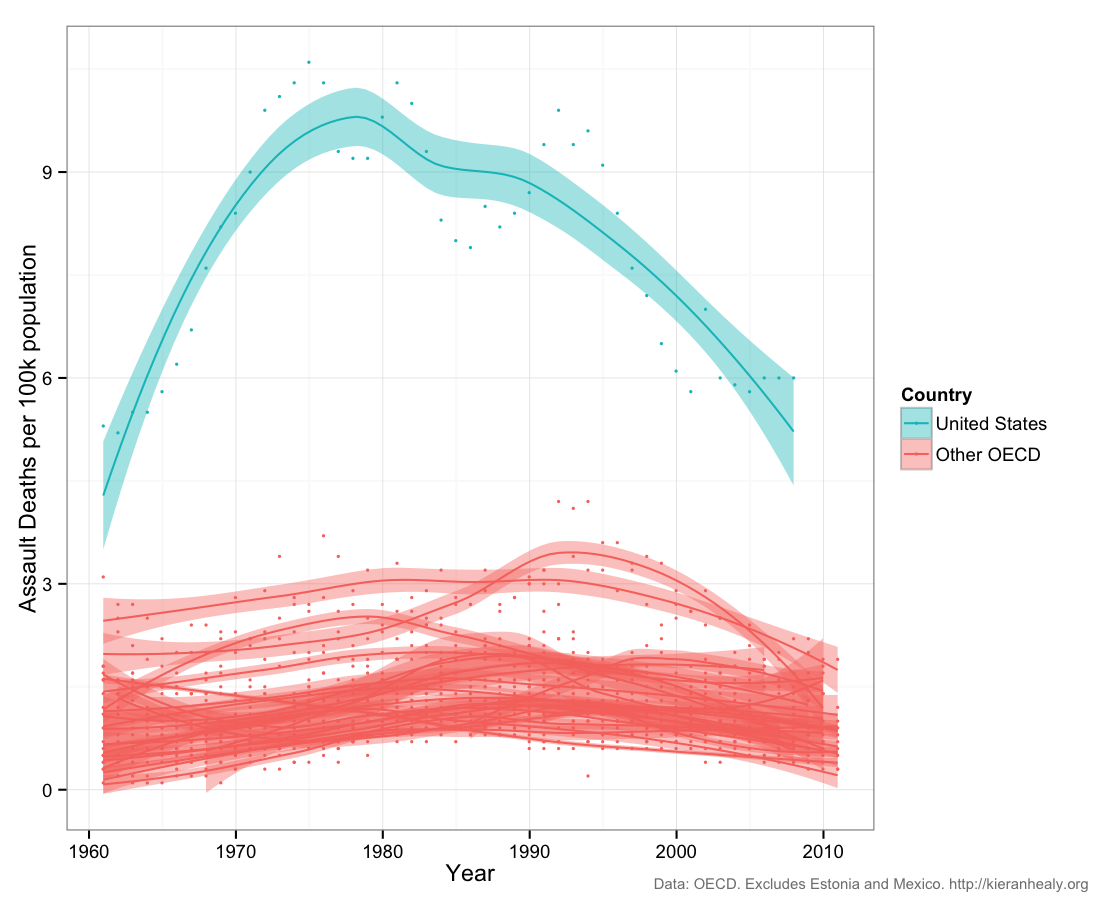
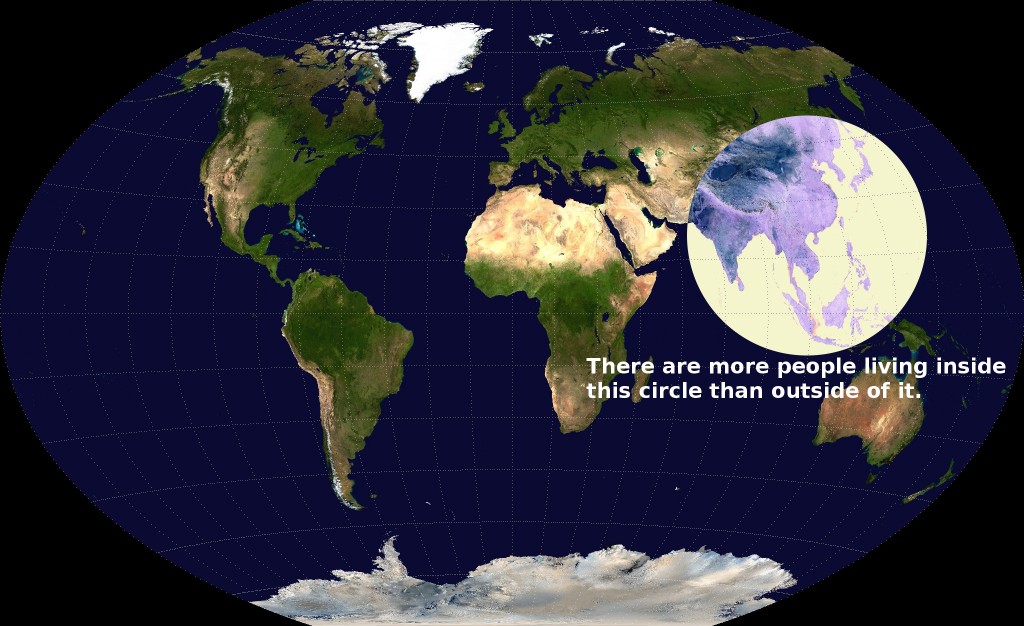
I love maps and charts. You will find 22 surprising ones here.

Here are some of my favorites:

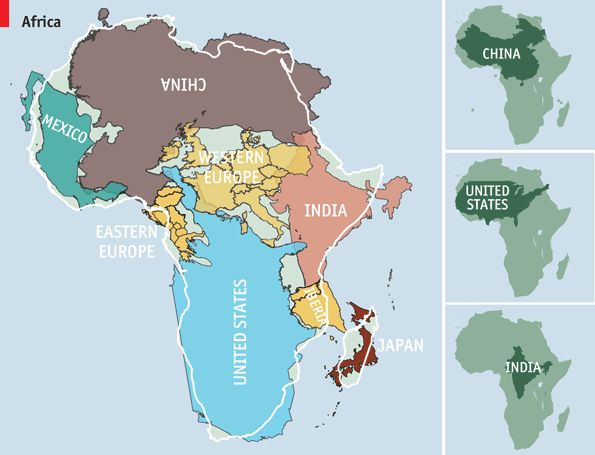
Africa is REALLY big:

Compare Canada and Continental Europe:


Colombia’s Data-Driven Fight Against Crime

From the New York Times


"Colombia has always been a violent country, but after the 1948 assassination of Jorge Eliécer Gaitán, a politician who threatened to break the oligarchy’s stranglehold, hundreds of thousands of people were killed over the next five years. The killings were due to scorched-earth battles between the two major political parties — both parties of the upper classes whose major difference was their names. Violence acquired capital letters and became known as La Violencia.

(...)

The dark ages returned with the rise of cocaine in the late 1970s. By the late 1980s and early 1990, the leading cause of death in several of Colombia’s major cities was homicide. The most deadly and infamous was Medellín, but this was also true in Cali.

In 1983, there were 23 homicides per 100,000 people in Cali. Ten years later the rate had reached 120, and some counts put it slightly higher. That’s more than twice as high as the homicide rate ever reached in Detroit, the most dangerous city in any developed country, which peaked in 1993 at 57.6.

But crime in Cali changed after Rodrigo Guerrero became mayor.
What Guerrero did to make Cali safer was remarkable because it worked, and because of the novelty of his strategy. Before becoming mayor, Guerrero was not a politician, but a Harvard-trained epidemiologist who was president of the Universidad del Valle in Cali. He set out to prevent murder the way a doctor prevents disease.
(...)
When Guerrero became mayor in 1992, the conventional wisdom was that the vast bulk of Cali’s murders stemmed from disputes over cocaine trafficking — at the time, the Cali Cartel was overtaking the Medellín Cartel in control of the cocaine trade.
But Guerrero didn’t assume, he measured. The police, courts and every other institution that counted murders all came up with different figures. Guerrero had weekly meetings with these groups and academic researchers to find more accurate figures. Then they mapped homicides by time and neighborhood.
That took about a year — and his term was only two and a half years — but he found something important: deaths were concentrated on weekends, especially payday weekends. 
(...)
“Things that happen on the weekend in our country are often associated with alcohol,” Guerrero said. So Cali started to look at alcohol in the blood of victims (few perpetrators were caught) — and found a large percentage of victims had very high levels. “My initial hypothesis was that this was drug trafficking,” he said. “But the traffickers were not going to wait for weekends to resolve their conflicts — and get their victims drunk.”
The astronomical murder rate was related to the cocaine trade, Guerrero concluded — but only indirectly. Cocaine created social disruption and intensified an already-violent culture. 
(...)
Guerrero banned the sale of alcohol after 1 a.m. on weeknights and 2 a.m. on Fridays and Saturdays. (That 2 a.m. is considered early closing says a lot about the problem.) As he expected, bar owners — and bar patrons — objected. Guerrero asked bars to try it for three months, but success was obvious nearly instantly. The effects were big enough to overcome the objections.
The other decree banned the carrying of guns — enforced by checkpoints and pat-downs — on payday weekends and holidays. The army, which held a monopoly on the manufacture and sale of guns, fought the law. But again, success was persuasive. Researchers compared gun ban days to similar days with no ban in Cali and in Bogotá, which replicated the program. They found that neighborhoods with the ban saw 14 percent fewer homicides in Cali and 13 percent fewer in Bogotá than neighborhoods without restrictions.
Together, those two decrees cut the homicide rate where they were instituted by 35 percent.
There was more: Since the data showed that a large majority of offenders were under 24, Guerrero instituted a curfew for young people in high crime neighborhoods between 11 p.m. and 5 a.m. on weekends.
(...)
The homicide rate declined. From its peak of 120 in 1994, it declined to 80 in 1997. Homicides also dropped in Bogotá and Medellín, which adopted Cali’s program.
Was Guerrero’s program responsible for the drop? It’s hard to separate the effects of the program from outside factors, such as the economy, Colombia’s guerrilla wars and the drug trade (most of the heads of the Cali Cartel were captured in 1995, which could cut either way on homicide). But the reduction in homicide in these three cities was much greater than in the rest of the country.
It’s difficult to say which parts were responsible. There is strong evidence that the gun and alcohol restrictions worked, but the fact that the overall rate in Cali didn’t start to drop until 1994 indicates that other pieces of the program — which were slower to implement and didn’t yield immediate results — mattered as well.
(...)
Perhaps the showcase of Guerrero’s ideas is not Cali, but Bogotá, which never wavered in its implementation of the program. The city’s homicide rate, which was more than 80 per 100,000 in 1993, is 16.7 per 100,000 today.
The gains did not hold in Cali, however. Mayors after Guerrero dismantled almost all the program (two left office early due to accusations of corruption or ties to traffickers). The murder rate went back up again.
But Guerrero is once again mayor of Cali, and once again, the homicide rate is dropping. This year it is on track to drop by more than 30 percent, which would put it at under 60 per 100,000."

Thursday, November 13, 2014

Bayesian statistics applied to Ebola mortality rate

According to this article, the Ebola mortality rate varies a lot across countries:

About two-thirds of the 2,387 people who’d contracted the disease before this year’s outbreak died worldwide. The fatality rate of more than 14,000 people who have been infected with Ebola in West Africa this year is 71 percent. But eight of the nine people who have been treated for the disease in the U.S. have recovered and been released from the hospital. One person has died.


The question addressed in the article is then: how to aggregate this information?

Bayesian statistics seemed like a promising option for estimating U.S. mortality, because it provides a framework for updating prior informed belief (mortality rate in prior outbreaks in the U.S. and elsewhere) with new information (the lower mortality rate in the U.S. in this outbreak).

(...)

Tony O’Hagan, emeritus professor of statistics at the University of Sheffield in the U.K., (...) started with the assumption that the Ebola mortality rate in the U.S. would be 30 percent, about half that in Africa — peppered with a liberal amount of uncertainty because it was essentially an educated guess. Then once he factored in the eight recoveries in nine U.S. cases, his estimate was of a mortality rate of 17 percent.
Waller offered some ideas for how to refine the analysis. What we want is a model that takes into account the individual attributes of each case when estimating the likelihood of death. Those attributes include age and health of the patient, time from first symptoms to start of treatment, training of medical staff and treatments used. What factors led to lower mortality in the U.S., and which can be replicated in the West African countries with climbing caseloads?
Building such a model would require detailed data not just on the nine U.S. patients, but on as many Ebola patients worldwide as possible. That data isn’t always collected and compiled in a usable way, though — especially in an emergency treatment setting.